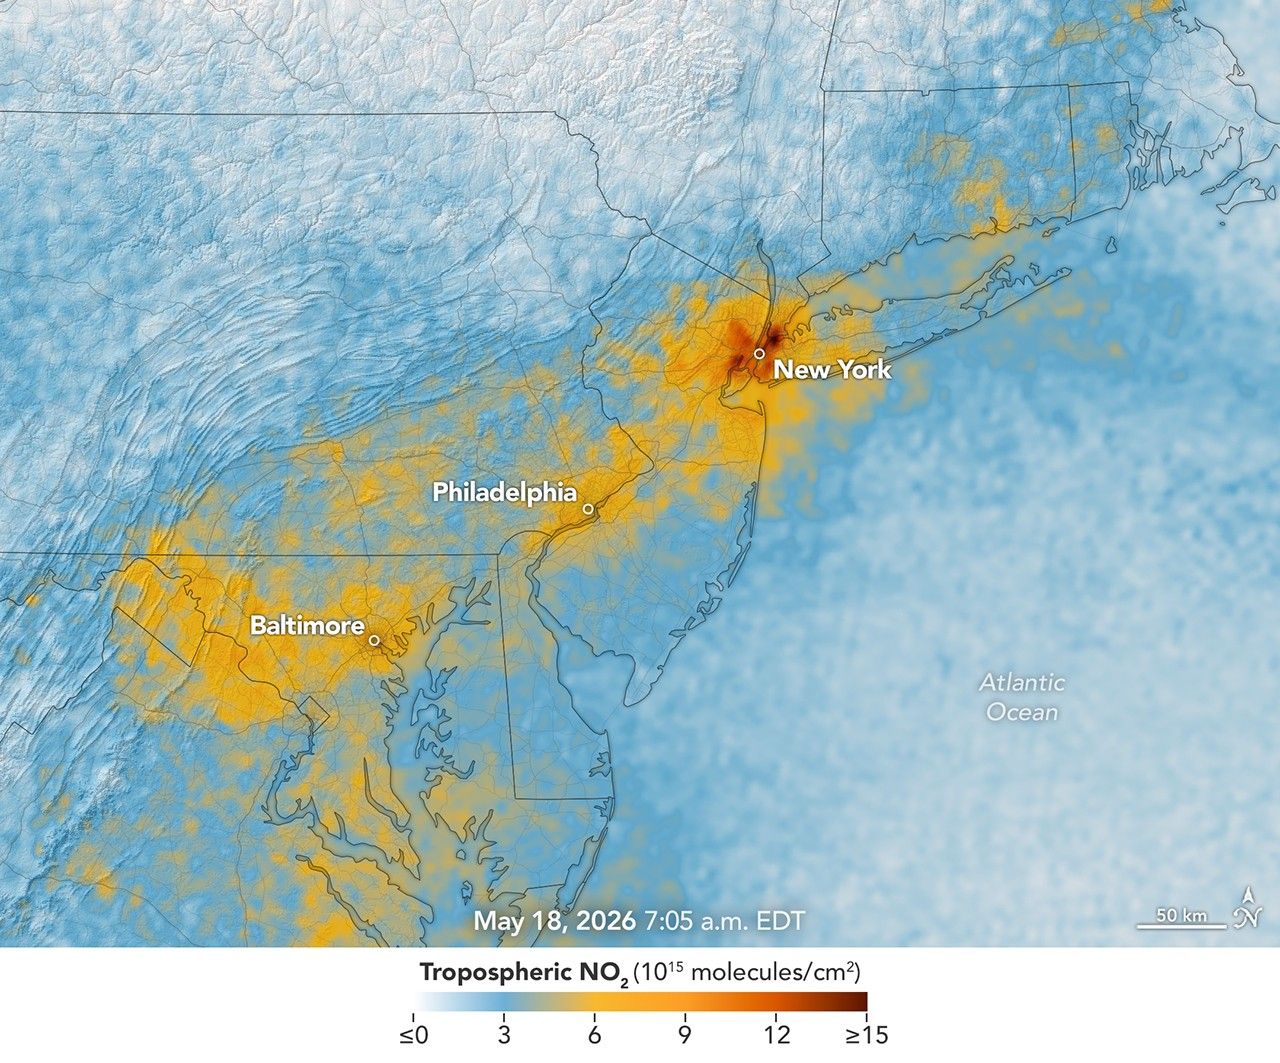
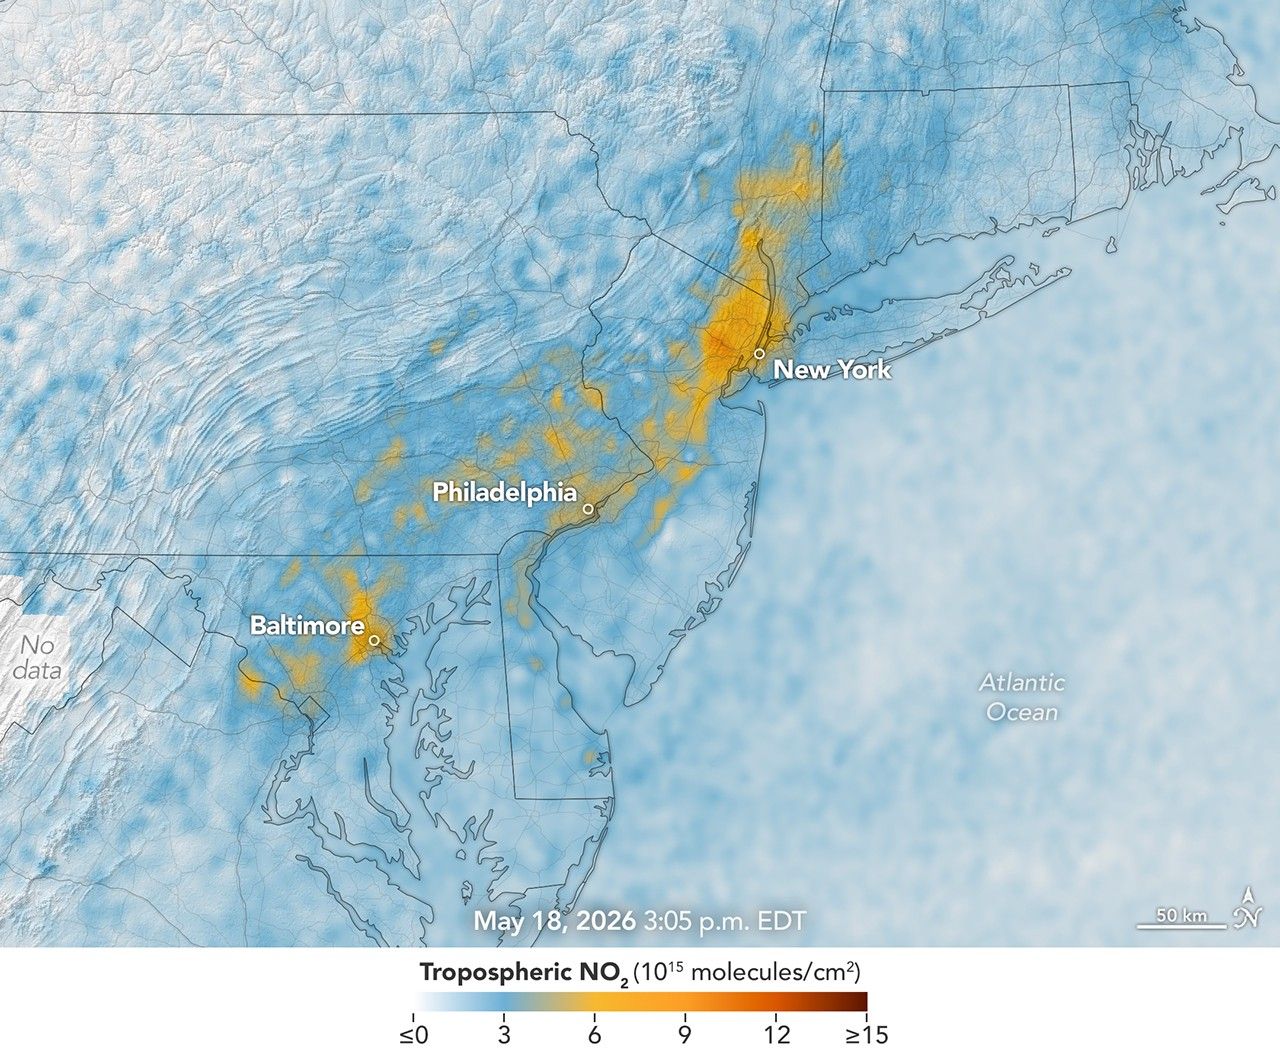
Skip to content
On the Weather

On the Weather

The Natural World in Beauty and Chaos

  • Home
  • About OTW
  • Privacy Policy
  • OTW Affiliates
  • Contact
Weather Blog
  • Home
  • All Regions
  • Weather Blog
  • Air Pollution’s Daily Pulse Over the Northeast
  • Weather Blog

Air Pollution’s Daily Pulse Over the Northeast

Air Pollution’s Daily Pulse Over the Northeast
  1. Science
  2. Earth Observatory
  3. Air Pollution’s Daily Pulse…
  • Earth
  • Earth Observatory
  • Image of the Day
  • EO Explorer
    • All Topics
    • Atmosphere
    • Land
    • Heat & Radiation
    • Life on Earth
    • Human Dimensions
    • Natural Events
    • Oceans
    • Remote Sensing Technology
    • Snow & Ice
    • Water
    • Collections
    • Global Maps
    • World of Change
    • Articles
    • Earth Matters Blog
    • Blue Marble: Next Generation
    • EO Kids
    • Mission: Biomes
    • About Us
    • Subscribe
    • 🛜 RSS
    • Contact Us
  • Search


7:05 am
3:05 pm

A map of morning nitrogen dioxide shows elevated concentrations of the gas over a region stretching from New York City to Washington, D.C., at 7:05 a.m. on May 18, 2026. A second map of the same area shows much lower concentrations that afternoon.
TEMPO detected high concentrations of nitrogen dioxide during the morning commute at 7:05 a.m. local time on May 18, 2026 (left), along the New York-Washington corridor. The instrument detected lower levels of the gas at 3:05 p.m. (right), after chemical reactions involving nitrogen dioxide had contributed to elevated ozone concentrations in the afternoon.
NASA Earth Observatory/Michala Garrison

7:05 am

3:05 pm


TEMPO detected high concentrations of nitrogen dioxide during the morning commute at 7:05 a.m. local time on May 18, 2026 (left), along the New York-Washington corridor.The instrument detected lower levels of the gas at 3:05 p.m. EDT (right), after chemical reactions involving nitrogen dioxide had contributed to elevated ozone concentrations in the afternoon. NASA Earth Observatory images by Michala Garrison.

More than 35 million people live along the New York–Washington corridor and breathe the region’s air. While air quality has improved significantly in recent decades, outbreaks of ground-level ozone remain common, particularly in the warm summer months, when the chemical reactions that produce the pollutant accelerate and stagnant air allows ozone to accumulate.

A reminder of this seasonal phenomenon came earlier than usual in 2026, when a mid-May heat wave prompted the New York State Department of Health and the New York Department of Environmental Conservation to issue a health advisory on May 17 over concerns about ozone. The code orange advisory warned young people, older adults, and those working or exercising outdoors to limit activity due to ozone’s respiratory and cardiovascular health impacts.

As expected, ground-based air-quality sensors operated by state and federal agencies showed ozone reaching unhealthy levels for sensitive groups on May 18, something that typically happens several times per year. Meanwhile, NASA’s TEMPO (Tropospheric Emissions: Monitoring of Pollution) instrument observed the event from geostationary orbit 22,000 miles (35,000 kilometers) above the equator, a unique vantage point that allows the sensor to collect frequent observations of air pollution.

TEMPO detects nitrogen dioxide (NO2), a gas emitted by burning fuels, particularly by motor vehicles, that contributes to ozone formation. “There’s often a clear and interesting pattern in TEMPO’s nitrogen dioxide data during ozone alert days,” said Hazem Mahmoud, an atmospheric scientist at NASA’s Atmospheric Science Data Center at Langley Research Center. “We see high concentrations of nitrogen dioxide during the early morning commute that drop off sharply in the late afternoon as ozone increases.”

The decline occurs as sunlight fuels photochemical reactions involving nitrogen dioxide, volatile organic compounds, and oxygen that lead to ozone formation. By late afternoon, these reactions deplete much of the available nitrogen dioxide, slowing ozone production until the cycle begins again the next day.

The pair of images above underscores the pattern. The image on the left was acquired at 7:05 a.m. local time when nitrogen dioxide concentrations were high during the morning commute. By 3:05 p.m. (right), most of the nitrogen dioxide had declined substantially, and surface ozone levels were elevated (below). Meanwhile, afternoon sea breezes appear to have transported the remaining nitrogen dioxide slightly to the west. Note that the data shown is provisional, and processing methods are still being refined.

Sensors on earlier polar-orbiting satellites, such as OMI (Ozone Monitoring Instrument) and TROPOMI (Tropospheric Monitoring Instrument), sampled nitrogen dioxide over New York once per day. After its launch in 2023, TEMPO began providing data every hour, allowing researchers to track the evolution and dispersion of air pollution at much finer time scales. 

“TEMPO is helping fill data gaps between ground stations and allowing us to ask new questions,” Mahmoud said. The mission provides data that can improve not only air quality forecasts during crisis situations, such as wildfires, but also the atmospheric models used to forecast the daily rhythms of urban pollution. Such models help researchers understand how natural factors such as winds, humidity levels, and air temperatures influence pollution plumes over the course of a day.

In a map of the eastern U.S., elevated ozone concentrations appear as a purple patch in an area extending from New York City to Washington, D.C.
TEMPO detected elevated ozone concentrations in an area extending from New York City to Washington, D.C., at 5:05 p.m. on May 18, 2026.
NASA Earth Observatory/Michala Garrison

TEMPO also detects ozone directly, but determining how much of that ozone is near the surface versus higher in the atmosphere can be challenging. Most of Earth’s ozone resides in the stratosphere, well above the troposphere, where people live and breathe. At times, however, stratospheric ozone can be transported downward into the troposphere. During events known as stratospheric intrusions, it can even descend far enough to affect air quality at the surface and add to the ozone produced at ground level.

By combining TEMPO observations with other sources of information, researchers are studying the processes that influence the distribution of ozone vertically in the atmosphere. On May 18, NASA’s ground-based tropospheric lidar network (TOLNet) in New York City recorded high concentrations of ozone near the surface, indicating that TEMPO was detecting mostly surface-level ozone associated with urban emissions and not ozone aloft, said Mahmoud.

However, on May 19, the same sensor observed a layer of ozone descending from above 5 kilometers (3 miles), he added, a clue that some of the ozone TEMPO detected that day may have originated in the stratosphere. “This is the type of information that leads to better air quality forecast models and more accurate alerts,” Mahmoud said. “Alerts can affect tens of millions of people and lead to disruptions in school, sports, and other activities, so it’s essential that they be as accurate as possible.”

On June 6, New York authorities issued another health advisory for ozone. People interested in following the event can access daily near-real-time TEMPO observations of ozone, nitrogen dioxide, and other gases on NASA’s Worldview browser, on an interactive Harvard & Smithsonian Center for Astrophysics browsing tool, and on NASA’s Earthdata portal.   

NASA Earth Observatory images by Michala Garrison, using TEMPO data from NASA Earthdata. Story by Adam Voiland.

Downloads

A map of morning nitrogen dioxide shows elevated concentrations of the gas over a region stretching from New York City to Washington, D.C., at 7:05 a.m. on May 18, 2026. A second map of the same area shows much lower concentrations that afternoon.

Nitrogen Dioxide – May 18, 2026 7:05 AM EDT

JPEG (2.52 MB)

A map of morning nitrogen dioxide shows elevated concentrations of the gas over a region stretching from New York City to Washington, D.C., at 7:05 a.m. on May 18, 2026. A second map of the same area shows much lower concentrations that afternoon.

Nitrogen Dioxide – May 18, 2026 3:05 PM EDT

JPEG (2.25 MB)

In a map of the eastern U.S., elevated ozone concentrations appear as a purple patch in an area extending from New York City to Washington, D.C.

Ozone – May 18, 2026 5:05 PM EDT

JPEG (2.10 MB)

References & Resources

  • Acker, S., et al. (2025) Satellite detection of NO2 distributions using TROPOMI and TEMPO and comparison with ground-based concentration measurements. Atmospheric Chemistry and Physics, 25(14), 8271-8288.
  • City of New York (2024) Community Air Survey Report: 2008-2024. Accessed June 9, 2026.
  • Energy Education, Ozone. Accessed June 10, 2026.     
  • Environmental Protection Agency (2026, May 13) What is Ozone? Accessed June 9, 2026.
  • Environmental Protection Agency (2025, July 10) Basic Information about NO2. Accessed June 9, 2026.
  • Holloway, T., et al. (2025) Satellite data to support air quality assessment and management. Journal of the Air & Waste Management Association, 75(6), 429-463.  
  • Lee, J., et al. (2024) The Evolutions and Large-Scale Mechanisms of Summer Stratospheric Ozone Intrusion Across Global Hotspots. JGR Atmospheres, 129(4),e2023JD039877.
  • NASA (2026) TOLNet. Accessed June 9, 2026.
  • NASA Air Quality (AQ) Monitoring from Space by NASA using TEMPO. Accessed June 9, 2026
  • NASA Air Quality (2026) Nitrogen Dioxide. Accessed June 9, 2026.
  • NASA Air Quality (2026) Nitrogen Dioxide Trends for US Cities. Accessed June 9, 2026.
  • NASA Earthdata (2024, May 3) TEMPO Mission Releases Beta Level 1, 2, and 3 Version 03 Data Products. Accessed June 9, 2026.
  • New York State Department of Environmental Conservation (2026, May 18) Air Quality Health Advisory Extended for New York City Metro Region. Accessed June 9, 2026.
  • Zhang, J., et al. (2026) Revealing the Formation and Control of NYC Downwind Coastal High Ozone via New TEMPO Observations. Geophysical Research Letters, 53(2),e2025GL117523.

You may also be interested in:

Stay up-to-date with the latest content from NASA as we explore the universe and discover more about our home planet.

Smoke Shrouds Northern Thailand

3 min read

Seasonal fires have darkened skies over Southeast Asia.

Article

Winter’s End Is Written in the Clouds

3 min read

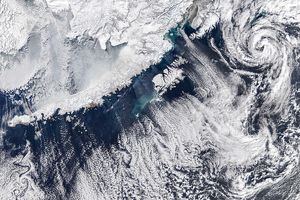
As winter turned to spring, the skies over the Gulf of Alaska displayed textbook examples of numerous cloud formations.

Article

Extreme January Cold

3 min read

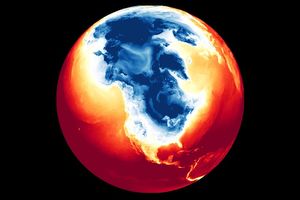
Following a significant winter storm, frigid temperatures lingered in late January 2026 across a vast swath of the U.S.

Article

1


2


3


4

Next
Keep Exploring

Discover More from NASA Earth Science

Subscribe to Earth Observatory Newsletters

Subscribe to the Earth Observatory and get the Earth in your inbox.


Earth Observatory Image of the Day

NASA’s Earth Observatory brings you the Earth, every day, with in-depth stories and stunning imagery.


Explore Earth Science


Earth Science Data

Open access to NASA’s archive of Earth science data

The post Air Pollution’s Daily Pulse Over the Northeast appeared first on NASA Science.

​  

About Author

OTW Observer

See author's posts

Post navigation

Previous London weather latest as capital to bathe in 35C temperatures, says expert

Related Stories

Tyndall’s Trail of Bergs Tyndall’s Trail of Bergs
  • Weather Blog

Tyndall’s Trail of Bergs

June 10, 2026
San Francisco’s Metropolitan Mosaic San Francisco’s Metropolitan Mosaic
  • Weather Blog

San Francisco’s Metropolitan Mosaic

June 9, 2026
NASA’s INCUS Satellites Progress Toward Launch NASA’s INCUS Satellites Progress Toward Launch
  • Weather Blog

NASA’s INCUS Satellites Progress Toward Launch

June 8, 2026

Recent Posts

Recent Comments

No comments to show.

Archives

  • June 2026
  • May 2026
  • April 2026
  • March 2026
  • February 2026
  • January 2026
  • December 2025
  • November 2025
  • October 2025
  • September 2025
  • August 2025
  • July 2025
  • June 2025
  • May 2025
  • April 2025
  • March 2025
  • February 2025
  • January 2025
  • December 2024
  • November 2024
  • October 2024
  • September 2024
  • August 2024
  • July 2024
  • June 2024
  • May 2024
  • April 2024
  • March 2024
  • February 2024
  • January 2024
  • December 2023
  • November 2023
  • October 2023
  • September 2023
  • August 2023
  • July 2023
  • June 2023
  • May 2023
  • April 2023
  • March 2023
  • February 2023
  • January 2023
  • December 2022
  • November 2022
  • August 2021
  • February 2021
  • June 2020
  • December 2018

Categories

  • All Regions
  • Americas
  • Asia-Pacific
  • Atlantic
  • Caribbean
  • Europe
  • Oceania
  • South China Sea
  • Weather Blog

Weather Media Roundup

Air Pollution’s Daily Pulse Over the Northeast Air Pollution’s Daily Pulse Over the Northeast
  • Weather Blog

Air Pollution’s Daily Pulse Over the Northeast

June 11, 2026
London weather latest as capital to bathe in 35C temperatures, says expert London weather latest as capital to bathe in 35C temperatures, says expert
  • All Regions
  • Europe

London weather latest as capital to bathe in 35C temperatures, says expert

June 10, 2026
Cristina about to make Landfall… Cristina about to make Landfall...
  • Caribbean

Cristina about to make Landfall…

June 10, 2026
Tyndall’s Trail of Bergs Tyndall’s Trail of Bergs
  • Weather Blog

Tyndall’s Trail of Bergs

June 10, 2026

OTW Hosting by Hostinger

Disclosure statement: Links to affiliate products are listed here. Ontheweather.com maybe compensated by displaying and promoting products seen here. Some of the products maybe of interest to you. Learn more about ontheweather.com privacy policy page.

Copyright © All rights reserved. OTW 2024 | DarkNews by AF themes.