Skip to content
On the Weather

On the Weather

The Natural World in Beauty and Chaos

  • Home
  • About OTW
  • Privacy Policy
  • OTW Affiliates
  • Contact
Weather Blog
  • Home
  • All Regions
  • Weather Blog
  • Picturing Earth in a New Light
  • Weather Blog

Picturing Earth in a New Light

Picturing Earth in a New Light
  1. Science
  2. Earth Observatory
  3. Picturing Earth in a New Light
  • Earth
  • Earth Observatory
  • Image of the Day
  • EO Explorer
    • All Topics
    • Atmosphere
    • Land
    • Heat & Radiation
    • Life on Earth
    • Human Dimensions
    • Natural Events
    • Oceans
    • Remote Sensing Technology
    • Snow & Ice
    • Water
    • Collections
    • Global Maps
    • World of Change
    • Articles
    • Notes from the Field Blog
    • Earth Matters Blog
    • Blue Marble: Next Generation
    • EO Kids
    • Mission: Biomes
    • About Us
    • Subscribe
    • 🛜 RSS
    • Contact Us
  • Search
 
A global map shows changes in artificial light at night from 2014 to 2022, with increases shown in yellow and orange and decreases shown in purple.
Some parts of the planet are shown to brighten (gold) and some dim (purple) in an analysis of nearly a decade of nighttime lights data from NASA’s Black Marble product.
NASA Earth Observatory/Michala Garrison

Maps can show more than just where things are—they can also show how things change. New maps of artificial light reveal a planet that has been reshaping its nights through patterns of brightening and dimming.

The maps are based on a recent analysis of NASA’s Black Marble data, which found that instead of a gradual increase in artificial light at night over the course of nearly a decade, the patterns are much more nuanced. The analysis portrays a world flickering with industrial booms and busts, construction, and blackouts, as well as more gradual shifts, such as policy-driven retrofits.

NASA’s Black Marble product uses observations from the VIIRS (Visible Infrared Imaging Radiometer Suite) sensors on the Suomi-NPP, NOAA-20, and NOAA-21 satellites to produce records of nighttime lights at daily, monthly, and yearly time scales. The VIIRS day-night band detects nighttime light in a range of wavelengths from green to near-infrared and uses filtering techniques to observe signals such as city lights, reflected moonlight, and auroras.

The map above shows changes in brightness across most of the inhabited world (between 60 degrees south and 70 degrees north). Yellow and gold areas are where there has been more brightening during the study period, from 2014 to 2022, and purple areas are where there has been more dimming.  

The visualization below shows the same data for the Eastern Hemisphere. Note that this version includes some artistic touches, such as simulated sunlight and shadows, while the nighttime lights data overlaid on the globe remain grounded in the scientific analysis. The image was featured on the cover of Nature, where the study was published in April 2026.

A data visualization shows changes in artificial light at night across the Eastern Hemisphere from 2014 to 2022, with increases shown in yellow and orange and decreases shown in purple.
An analysis of nearly a decade of nighttime lights data (2014-2022) from NASA’s Black Marble product revealed areas of brightening (gold) and dimming (purple) shown here across the Eastern Hemisphere.
NASA Earth Observatory/Michala Garrison

Overall, the researchers found that global radiance increased by 34 percent during the study period, but that surge masks large areas of dimming. Such “bidirectional changes” often happen side by side. In the U.S., for example, West Coast cities grew brighter as their populations increased, while much of the East Coast showed dimming, which the team attributed to the increased use of energy-efficient LEDs and broader economic restructuring.

The authors concluded that internationally, nighttime light surged in China and northern India along with urban development, while LEDs and energy conservation measures coincided with reduced light pollution in Paris and throughout France (a 33 percent dimming), the UK (22 percent dimming), and the Netherlands (21 percent dimming). European nights dimmed sharply in 2022 during a regional energy crisis that followed the outbreak of the Russia-Ukraine conflict.

Large versions of the maps on this page can be downloaded below. Animations showing annual changes in nighttime lights throughout the study period are available from NASA’s Scientific Visualization Studio.

NASA Earth Observatory images by Michala Garrison, using data from Li, T., et al. (2026). Story by Sally Younger adapted for Earth Observatory by Kathryn Hansen.

Downloads

A global map shows changes in artificial light at night from 2014 to 2022, with increases shown in yellow and orange and decreases shown in purple.

Global map: 2014-2022

JPEG (1.90 MB)

A data visualization shows changes in artificial light at night across the Eastern Hemisphere from 2014 to 2022, with increases shown in yellow and orange and decreases shown in purple.

Eastern Hemisphere: 2014-2022

JPEG (3.51 MB)

References & Resources

  • Li, T., et al. (2026) Satellite imagery reveals increasing volatility in human night-time activity. Nature, 652, 379–386.
  • NASA (2026, April 13) NASA Night-light Imagery Tracks US Energy Transition, Global Volatility. Accessed May 14, 2026.
  • NASA’s Scientific Visualization Studio (2026, April 8) Global Nighttime Lights Change (2014–2022). Accessed May 14, 2026.

You may also be interested in:

Stay up-to-date with the latest content from NASA as we explore the universe and discover more about our home planet.

North America’s Greenhouse Hub

3 min read

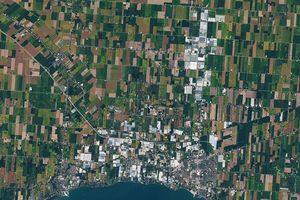
The expansion of greenhouses in southern Ontario is changing the appearance of the land surface—and the night sky.

Article

Northern Glow Spans Iceland and Canada

3 min read

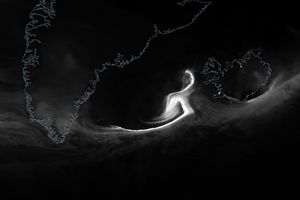
A vivid display of the aurora lit up skies over the Denmark Strait and eastern Canada during a minor geomagnetic…

Article

Shades of a Lunar Eclipse

3 min read

A series of nighttime satellite images revealed how moonlight reaching Earth varied throughout a total lunar eclipse.

Article

1


2


3


4

Next
Keep Exploring

Discover More from NASA Earth Science

Subscribe to Earth Observatory Newsletters

Subscribe to the Earth Observatory and get the Earth in your inbox.


Earth Observatory Image of the Day

NASA’s Earth Observatory brings you the Earth, every day, with in-depth stories and stunning imagery.


Explore Earth Science


Earth Science Data

Open access to NASA’s archive of Earth science data

The post Picturing Earth in a New Light appeared first on NASA Science.

​  

About Author

OTW Observer

See author's posts

Post navigation

Previous Two Tropical Waves approach with Drought getting Worse…

Related Stories

Ice Moves Out of Aniak Ice Moves Out of Aniak
  • Weather Blog

Ice Moves Out of Aniak

May 14, 2026
America’s Emerald Isle America’s Emerald Isle
  • Weather Blog

America’s Emerald Isle

May 13, 2026
NASA’s Perseverance Captures Panorama at ‘Arbot’ NASA’s Perseverance Captures Panorama at ‘Arbot’
  • Weather Blog

NASA’s Perseverance Captures Panorama at ‘Arbot’

May 12, 2026

Recent Posts

Recent Comments

No comments to show.

Archives

  • May 2026
  • April 2026
  • March 2026
  • February 2026
  • January 2026
  • December 2025
  • November 2025
  • October 2025
  • September 2025
  • August 2025
  • July 2025
  • June 2025
  • May 2025
  • April 2025
  • March 2025
  • February 2025
  • January 2025
  • December 2024
  • November 2024
  • October 2024
  • September 2024
  • August 2024
  • July 2024
  • June 2024
  • May 2024
  • April 2024
  • March 2024
  • February 2024
  • January 2024
  • December 2023
  • November 2023
  • October 2023
  • September 2023
  • August 2023
  • July 2023
  • June 2023
  • May 2023
  • April 2023
  • March 2023
  • February 2023
  • January 2023
  • December 2022
  • November 2022
  • August 2021
  • February 2021
  • June 2020
  • December 2018

Categories

  • All Regions
  • Americas
  • Asia-Pacific
  • Atlantic
  • Caribbean
  • Europe
  • Oceania
  • South China Sea
  • Weather Blog

Weather Media Roundup

Picturing Earth in a New Light Picturing Earth in a New Light
  • Weather Blog

Picturing Earth in a New Light

May 15, 2026
Two Tropical Waves approach with Drought getting Worse… Two Tropical Waves approach with Drought getting Worse...
  • Caribbean

Two Tropical Waves approach with Drought getting Worse…

May 14, 2026
How hot does it have to be for a heatwave as London temperatures set to soar next week How hot does it have to be for a heatwave as London temperatures set to soar next week
  • All Regions
  • Europe

How hot does it have to be for a heatwave as London temperatures set to soar next week

May 14, 2026
Ice Moves Out of Aniak Ice Moves Out of Aniak
  • Weather Blog

Ice Moves Out of Aniak

May 14, 2026

OTW Hosting by Hostinger

Disclosure statement: Links to affiliate products are listed here. Ontheweather.com maybe compensated by displaying and promoting products seen here. Some of the products maybe of interest to you. Learn more about ontheweather.com privacy policy page.

Copyright © All rights reserved. OTW 2024 | DarkNews by AF themes.